Statistics
The Statistics page provides a comprehensive overview of your AI agent's performance, user engagement, and conversation quality. Use these insights to optimize your agent's behavior and improve customer satisfaction.
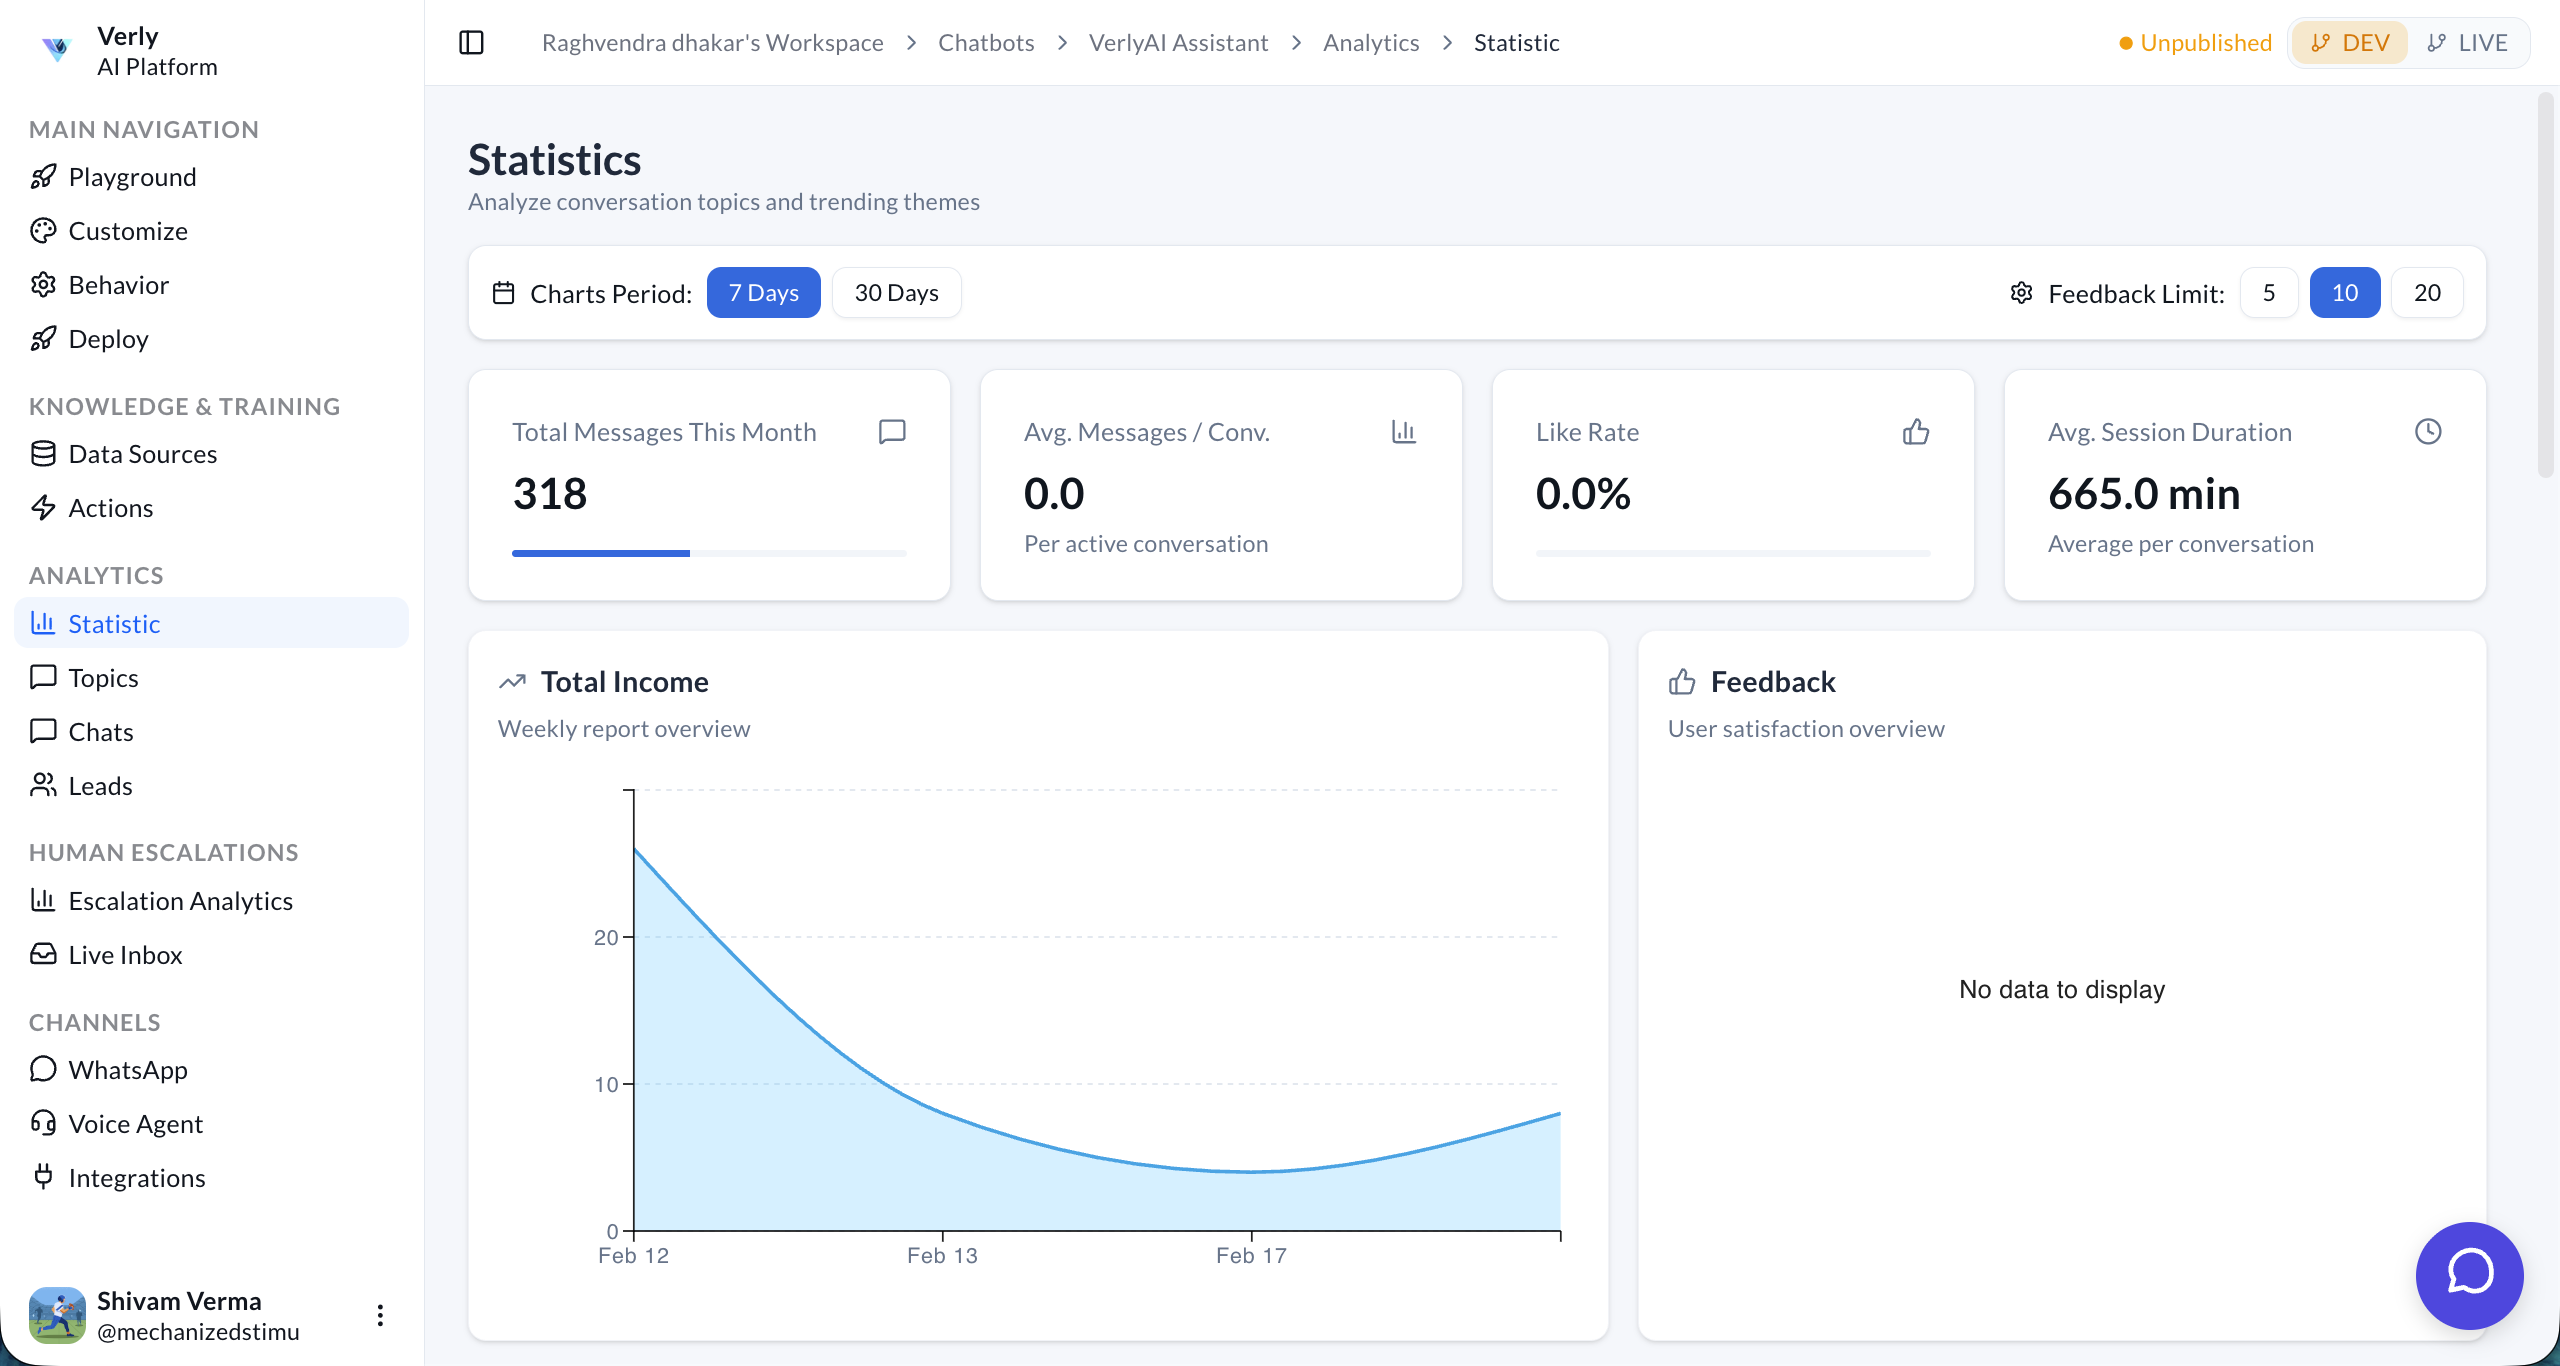
Key Metrics
At the top of the dashboard, you'll find four key performance indicators (KPIs) for the selected period:
- Total Messages: The total number of messages exchanged between the agent and users.
- Avg. Messages / Conv.: The average depth of a conversation. Higher numbers may indicate complex queries or good engagement.
- Like Rate: The percentage of positive feedback received from users.
- Avg. Session Duration: The average time users spend interacting with the agent.
Income Analysis
Track the financial impact of your AI agent. The Total Income chart displays a weekly report overview, helping you visualize revenue trends over time.
Conversation Volume
Understand your traffic patterns with the Conversations chart. This bar graph shows the volume of daily conversations, allowing you to identify peak usage times and trends.
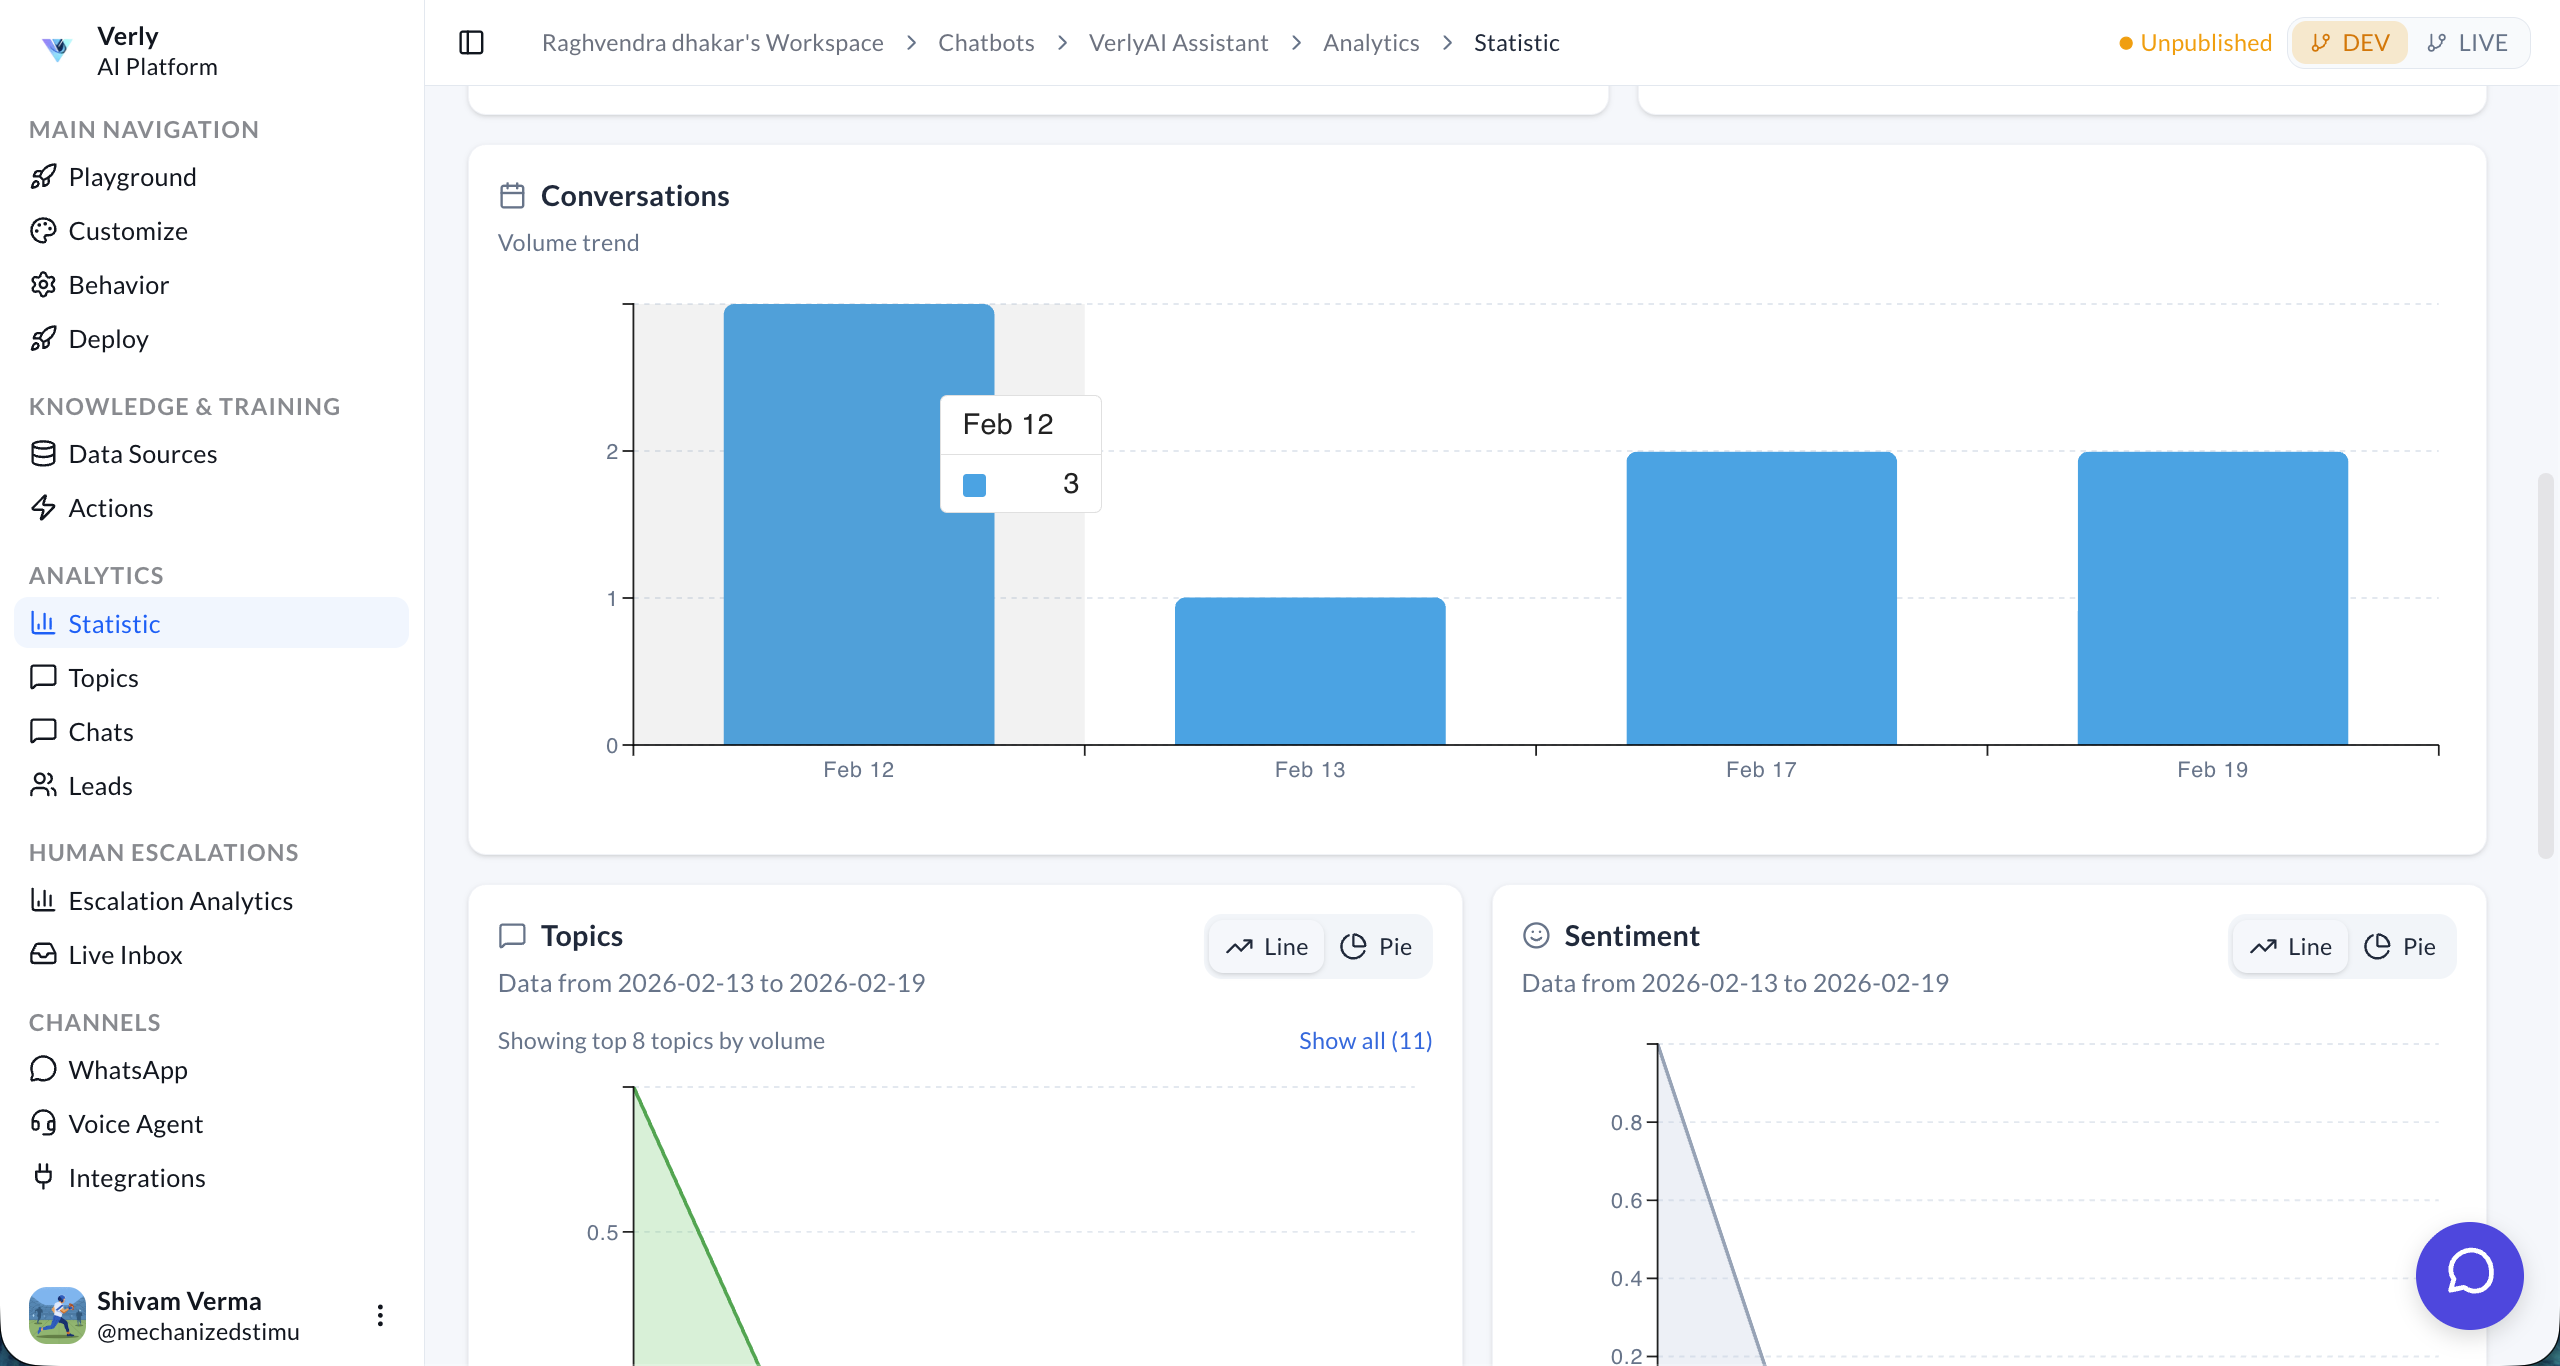
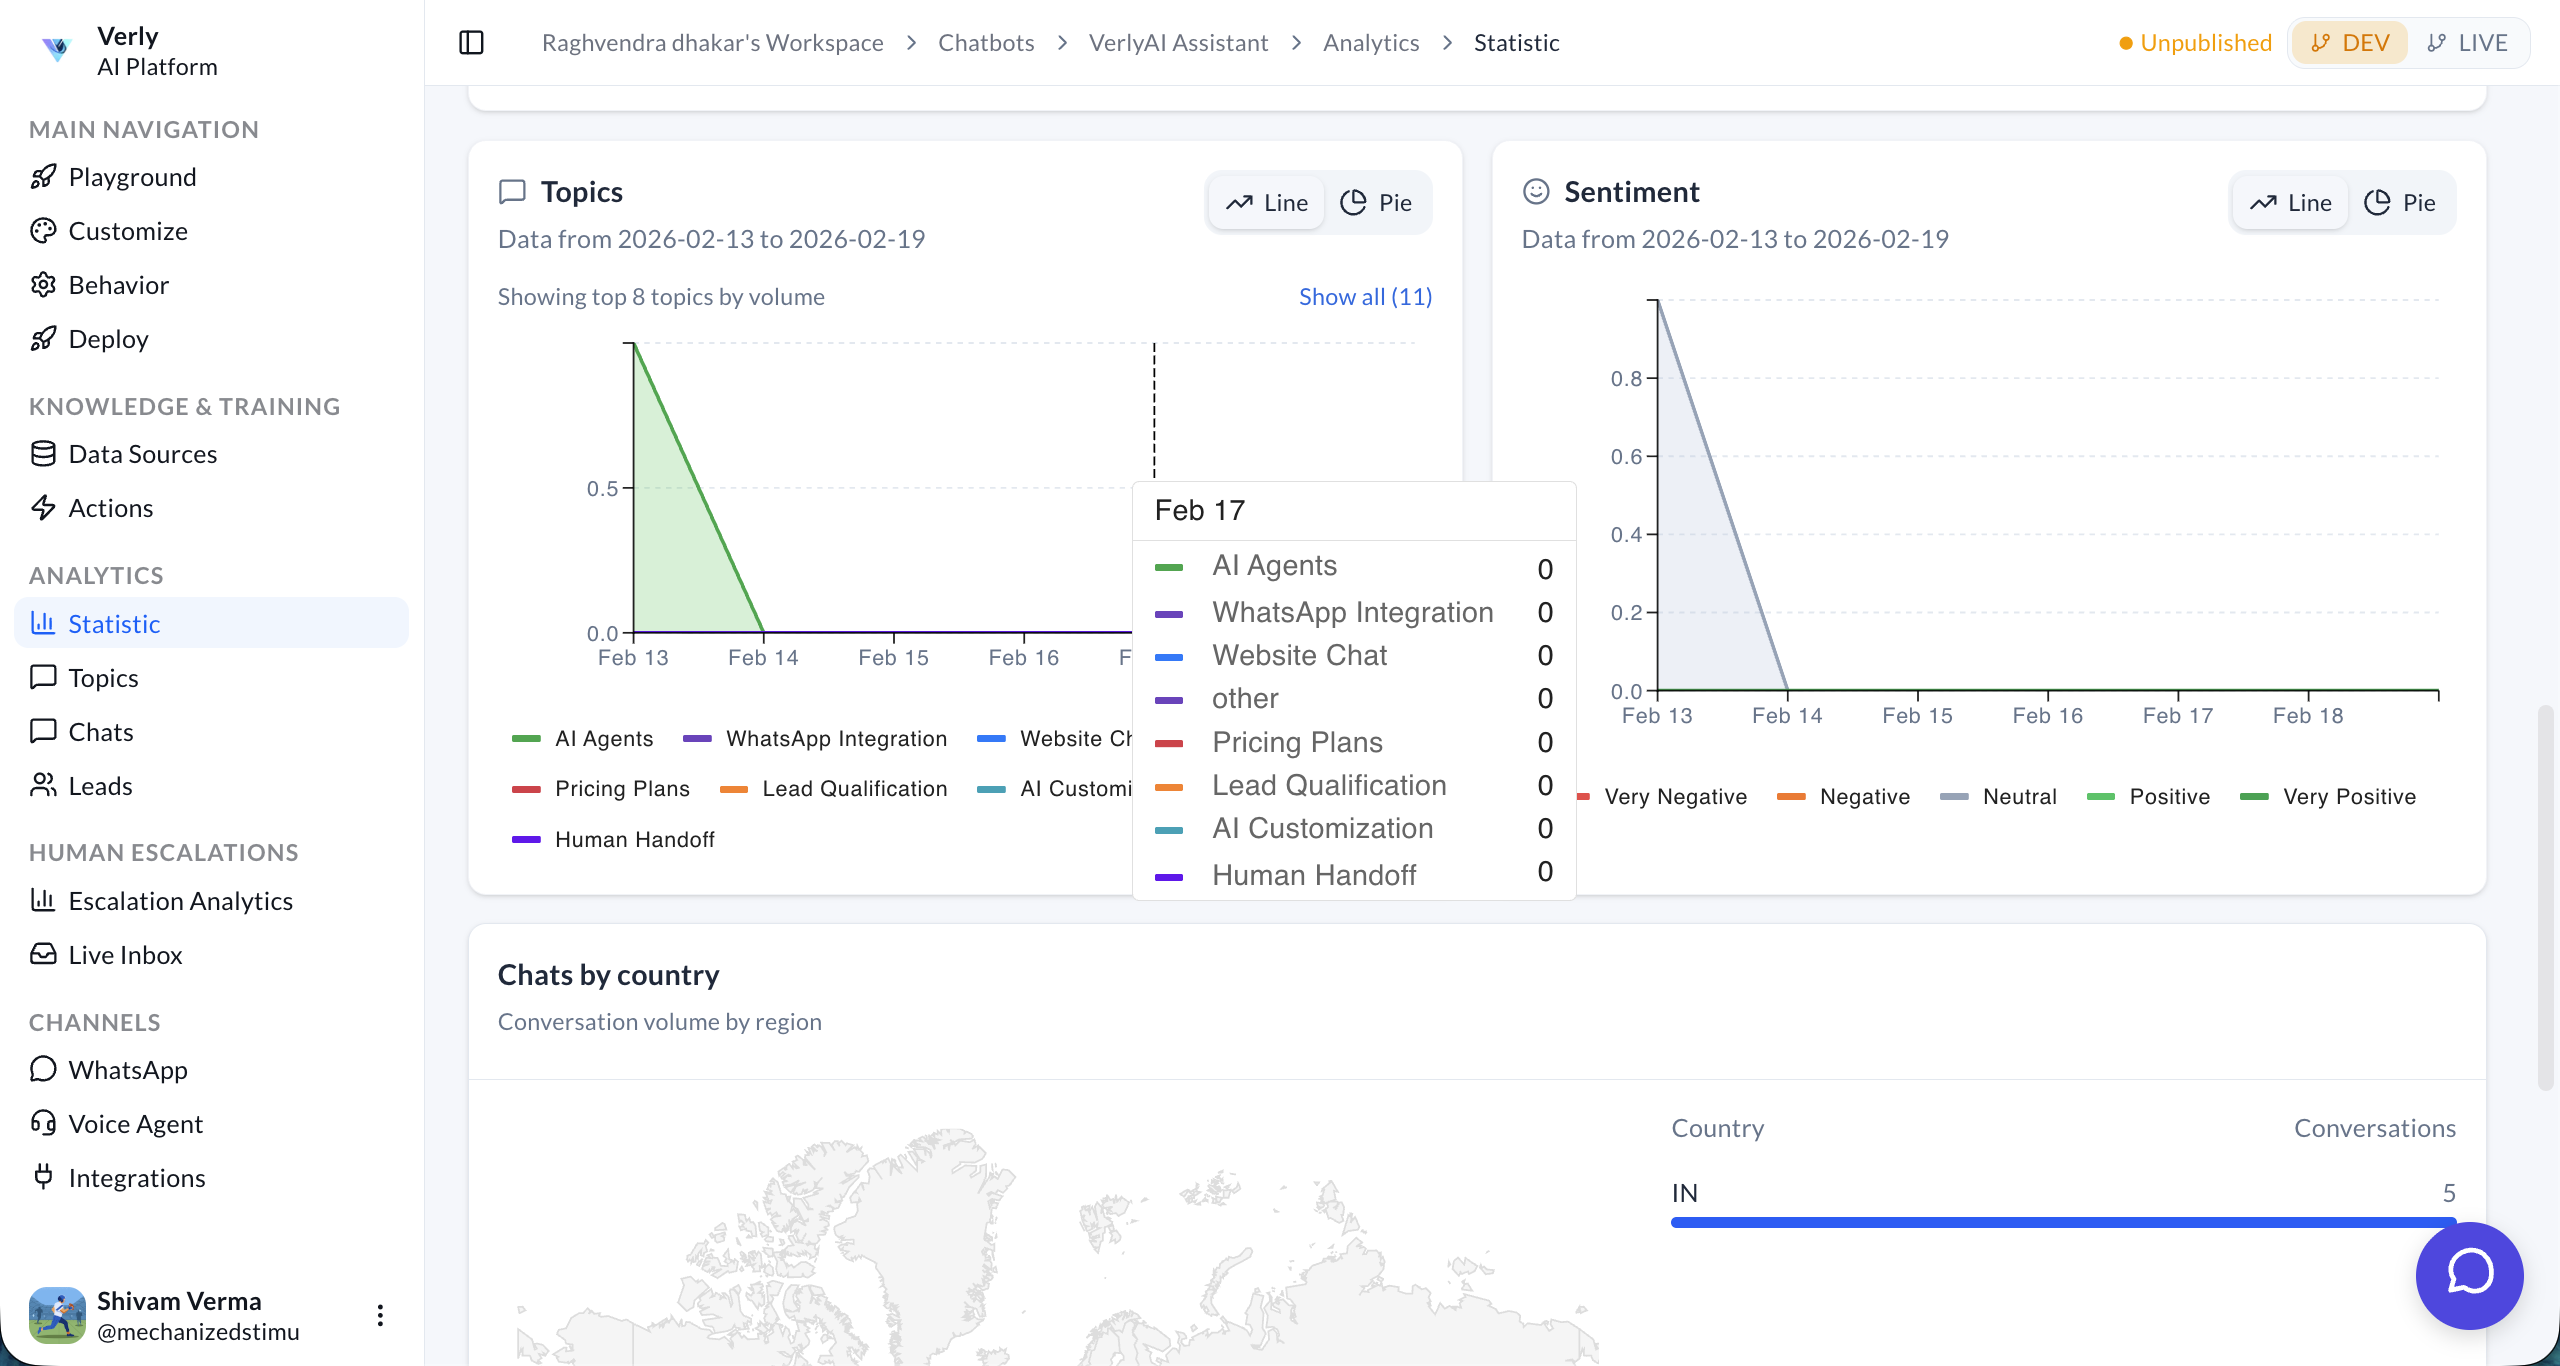
Topics & Sentiment
Gain deeper insights into what your users are talking about and how they feel.
- Topics: A line chart showing the volume of specific conversation topics over time. This helps you identify trending issues or popular requests.
- Sentiment: An analysis of user sentiment (Positive, Neutral, Negative) throughout conversations.
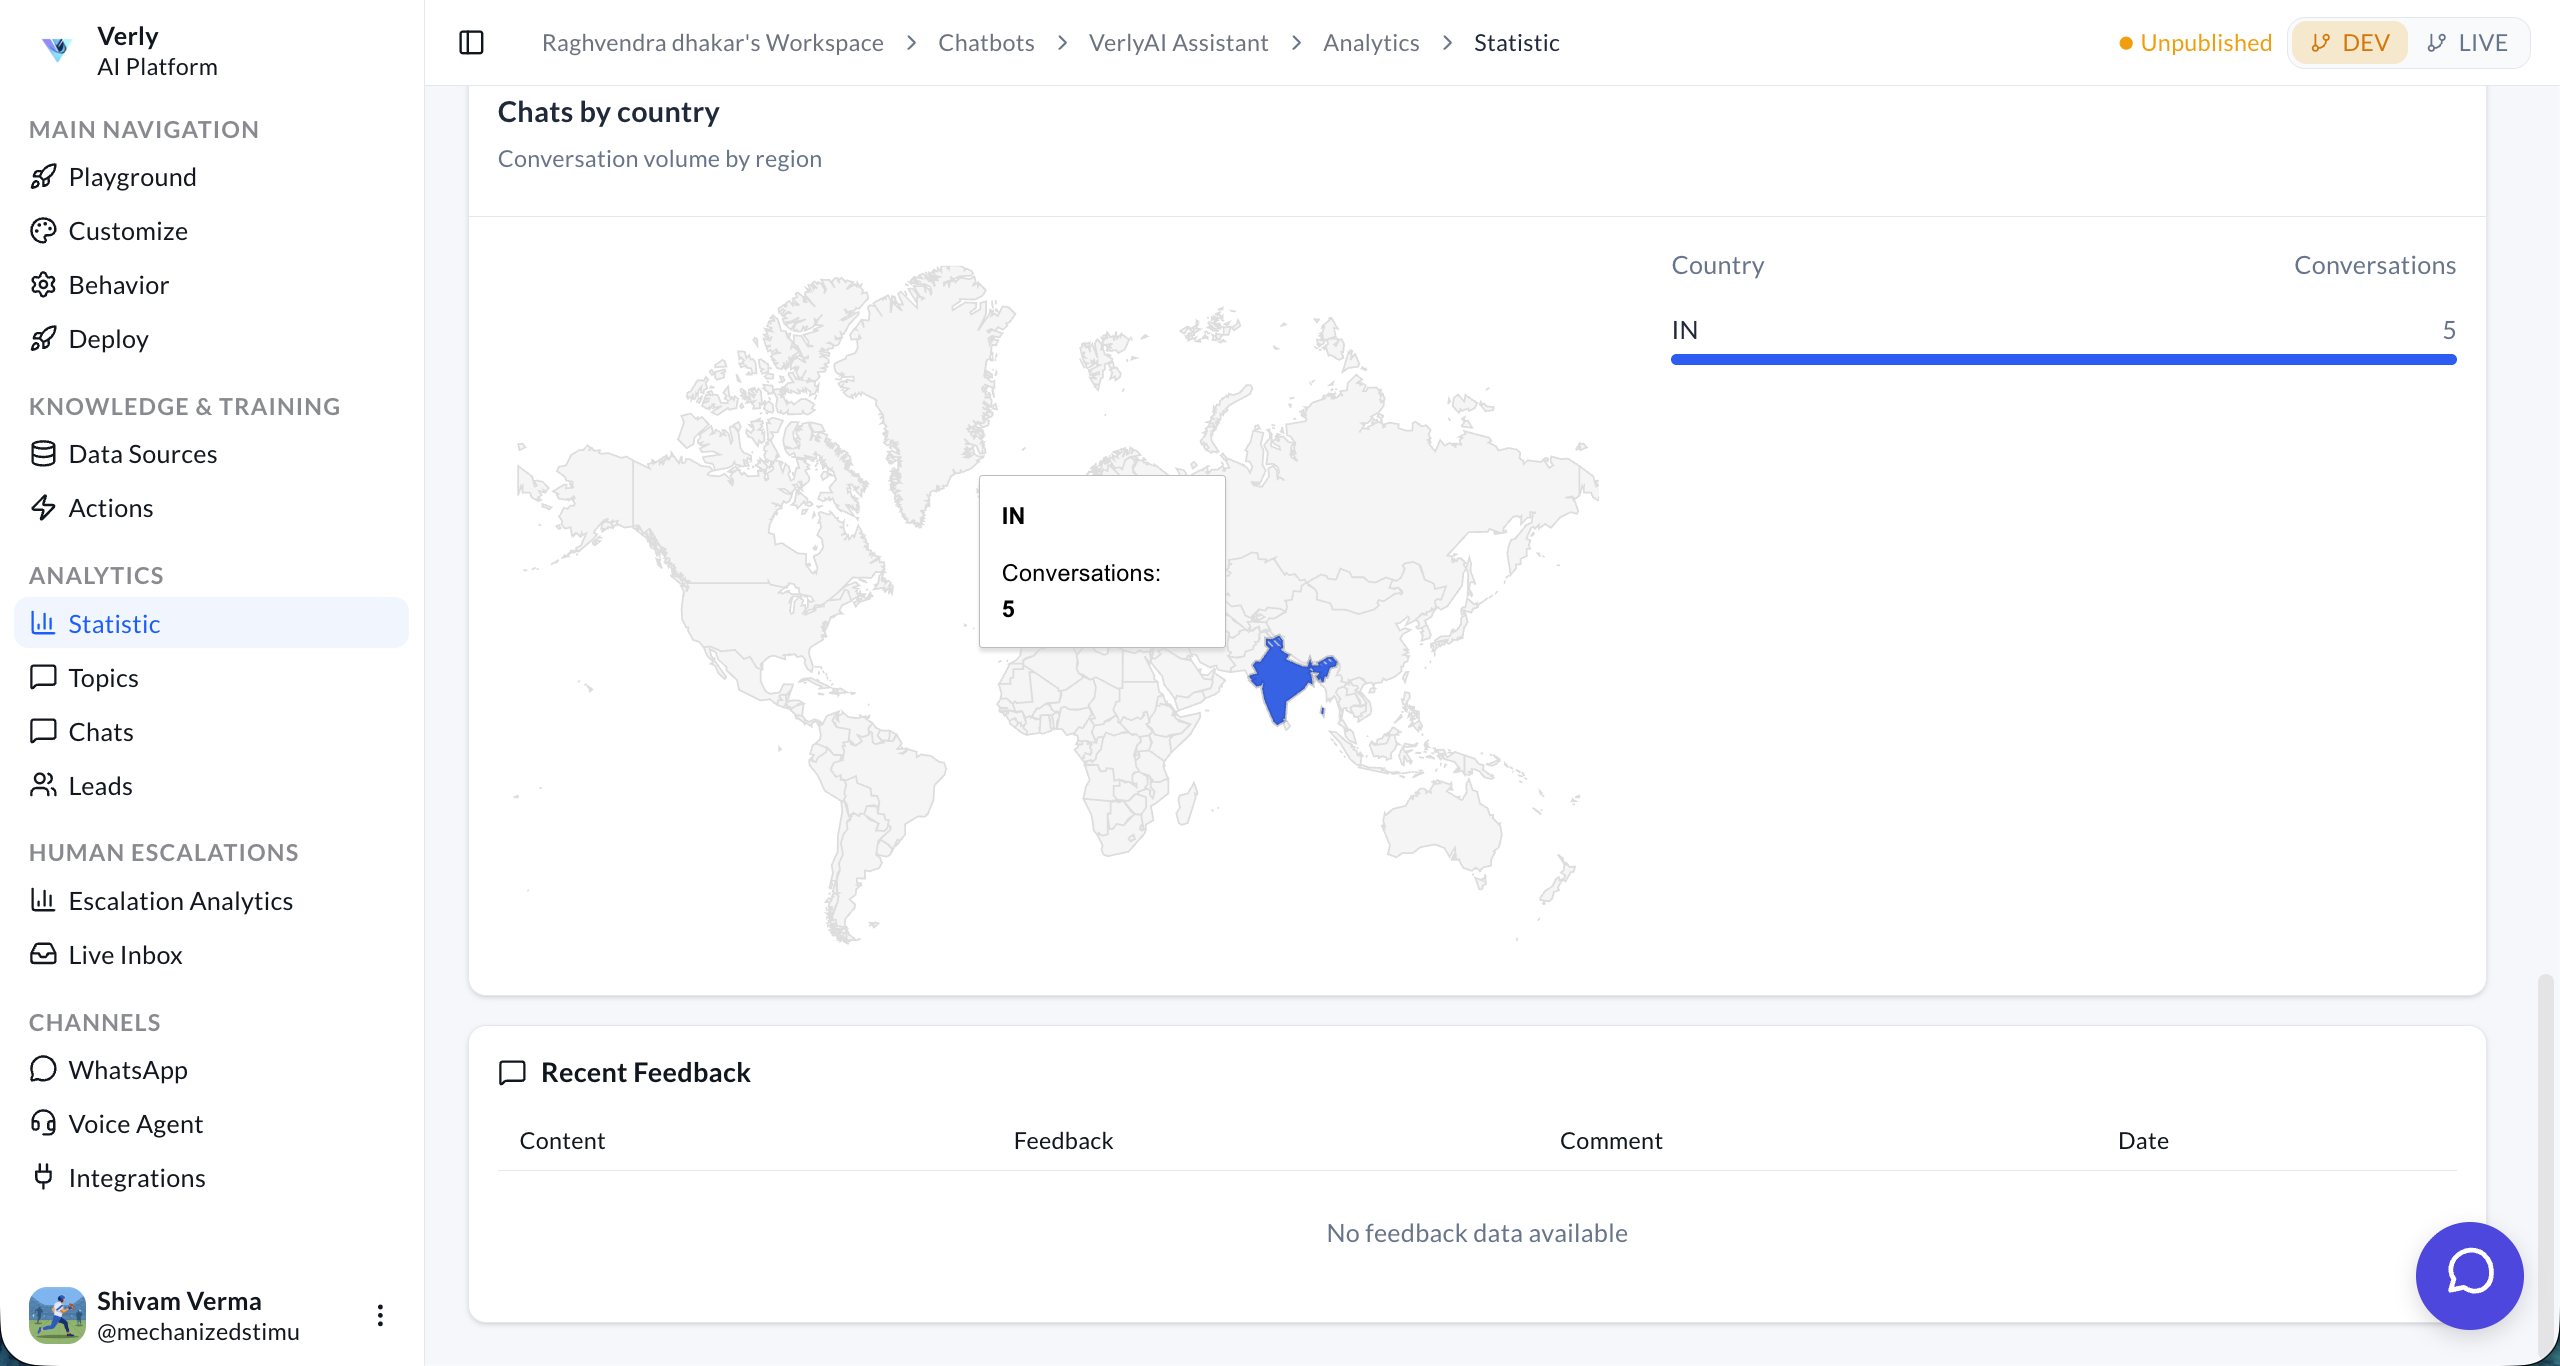
Geographic Distribution & Feedback
See where your users are coming from and what they are saying.
- Chats by Country: A world map visualizing conversation volume by region.
- Recent Feedback: A list of specific user feedback, including their comments and satisfaction ratings.